Introduction
I've had only very limited time to look at the
latest TestPilot
dataset so far, but once I saw the browser liveness events and the
fact that events are timestamped I figured it'd be fun to look at the
times of the day when people use Firefox the most. Click on any of
the images below for a larger version.
Method
I imported the data into a database and computed intervals of
continuous browser usage, i.e., intervals from timestamps of events
BROWSER_START to BROWSER_SHUTDOWN or BROWSER_RESTART, subtracting out
any intervals from BROWSER_INACTIVE to BROWSER_ACTIVATE. I also
folded any intervals that crossed midnights into two intervals, so I
could focus on a 24-hour day. I then accumulated the usage intervals
over one-minute windows spanning a day while keeping track of the days
of the week, and wrote out datafiles that besides overall activity in
each minute also break activity down by age group. I've recently
started to look at ggplot2 for
plotting (coming from a Matlab background and finding R's plotting not
very enjoyable), and this seemed a great opportunity to test it
further. I am growing fond of it.
Data calibration
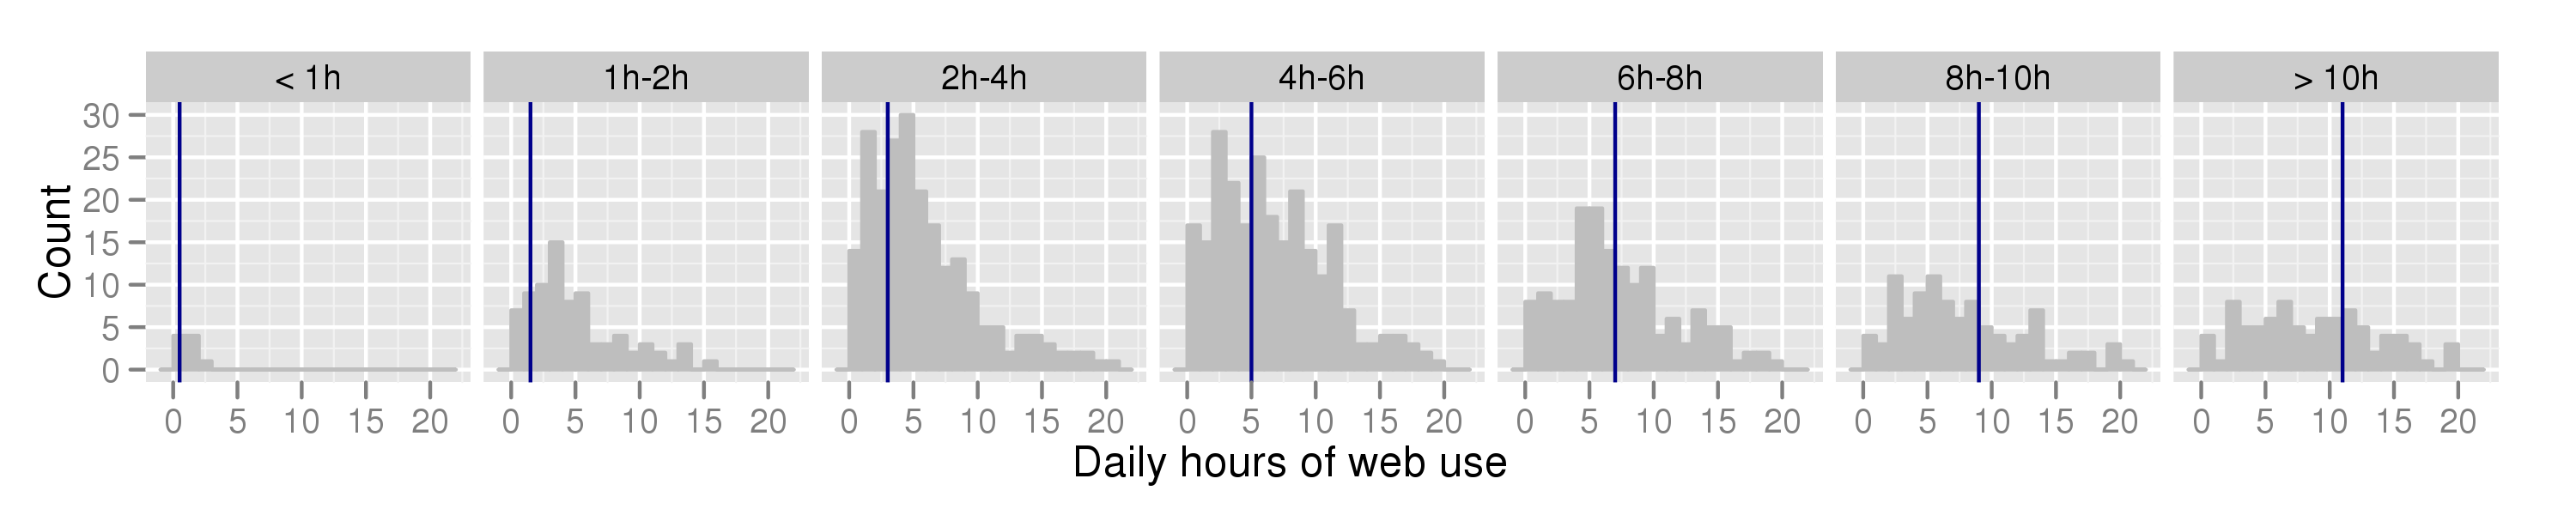
To make sure the computed intervals make some sense, below is a graph
that shows for each amount of time that users claimed to be using the
web each day the distribution of activity computed from activity
intervals on days on which these users were active. The vertical blue
line indicates the amount stated in the survey. (For < 1h I assumed
30 minutes, for > 10h I assumed 11h.)
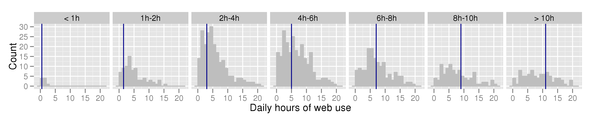
We see that while the spread around the claimed amount of time is
quite broad, it largely is reasonable.
Results
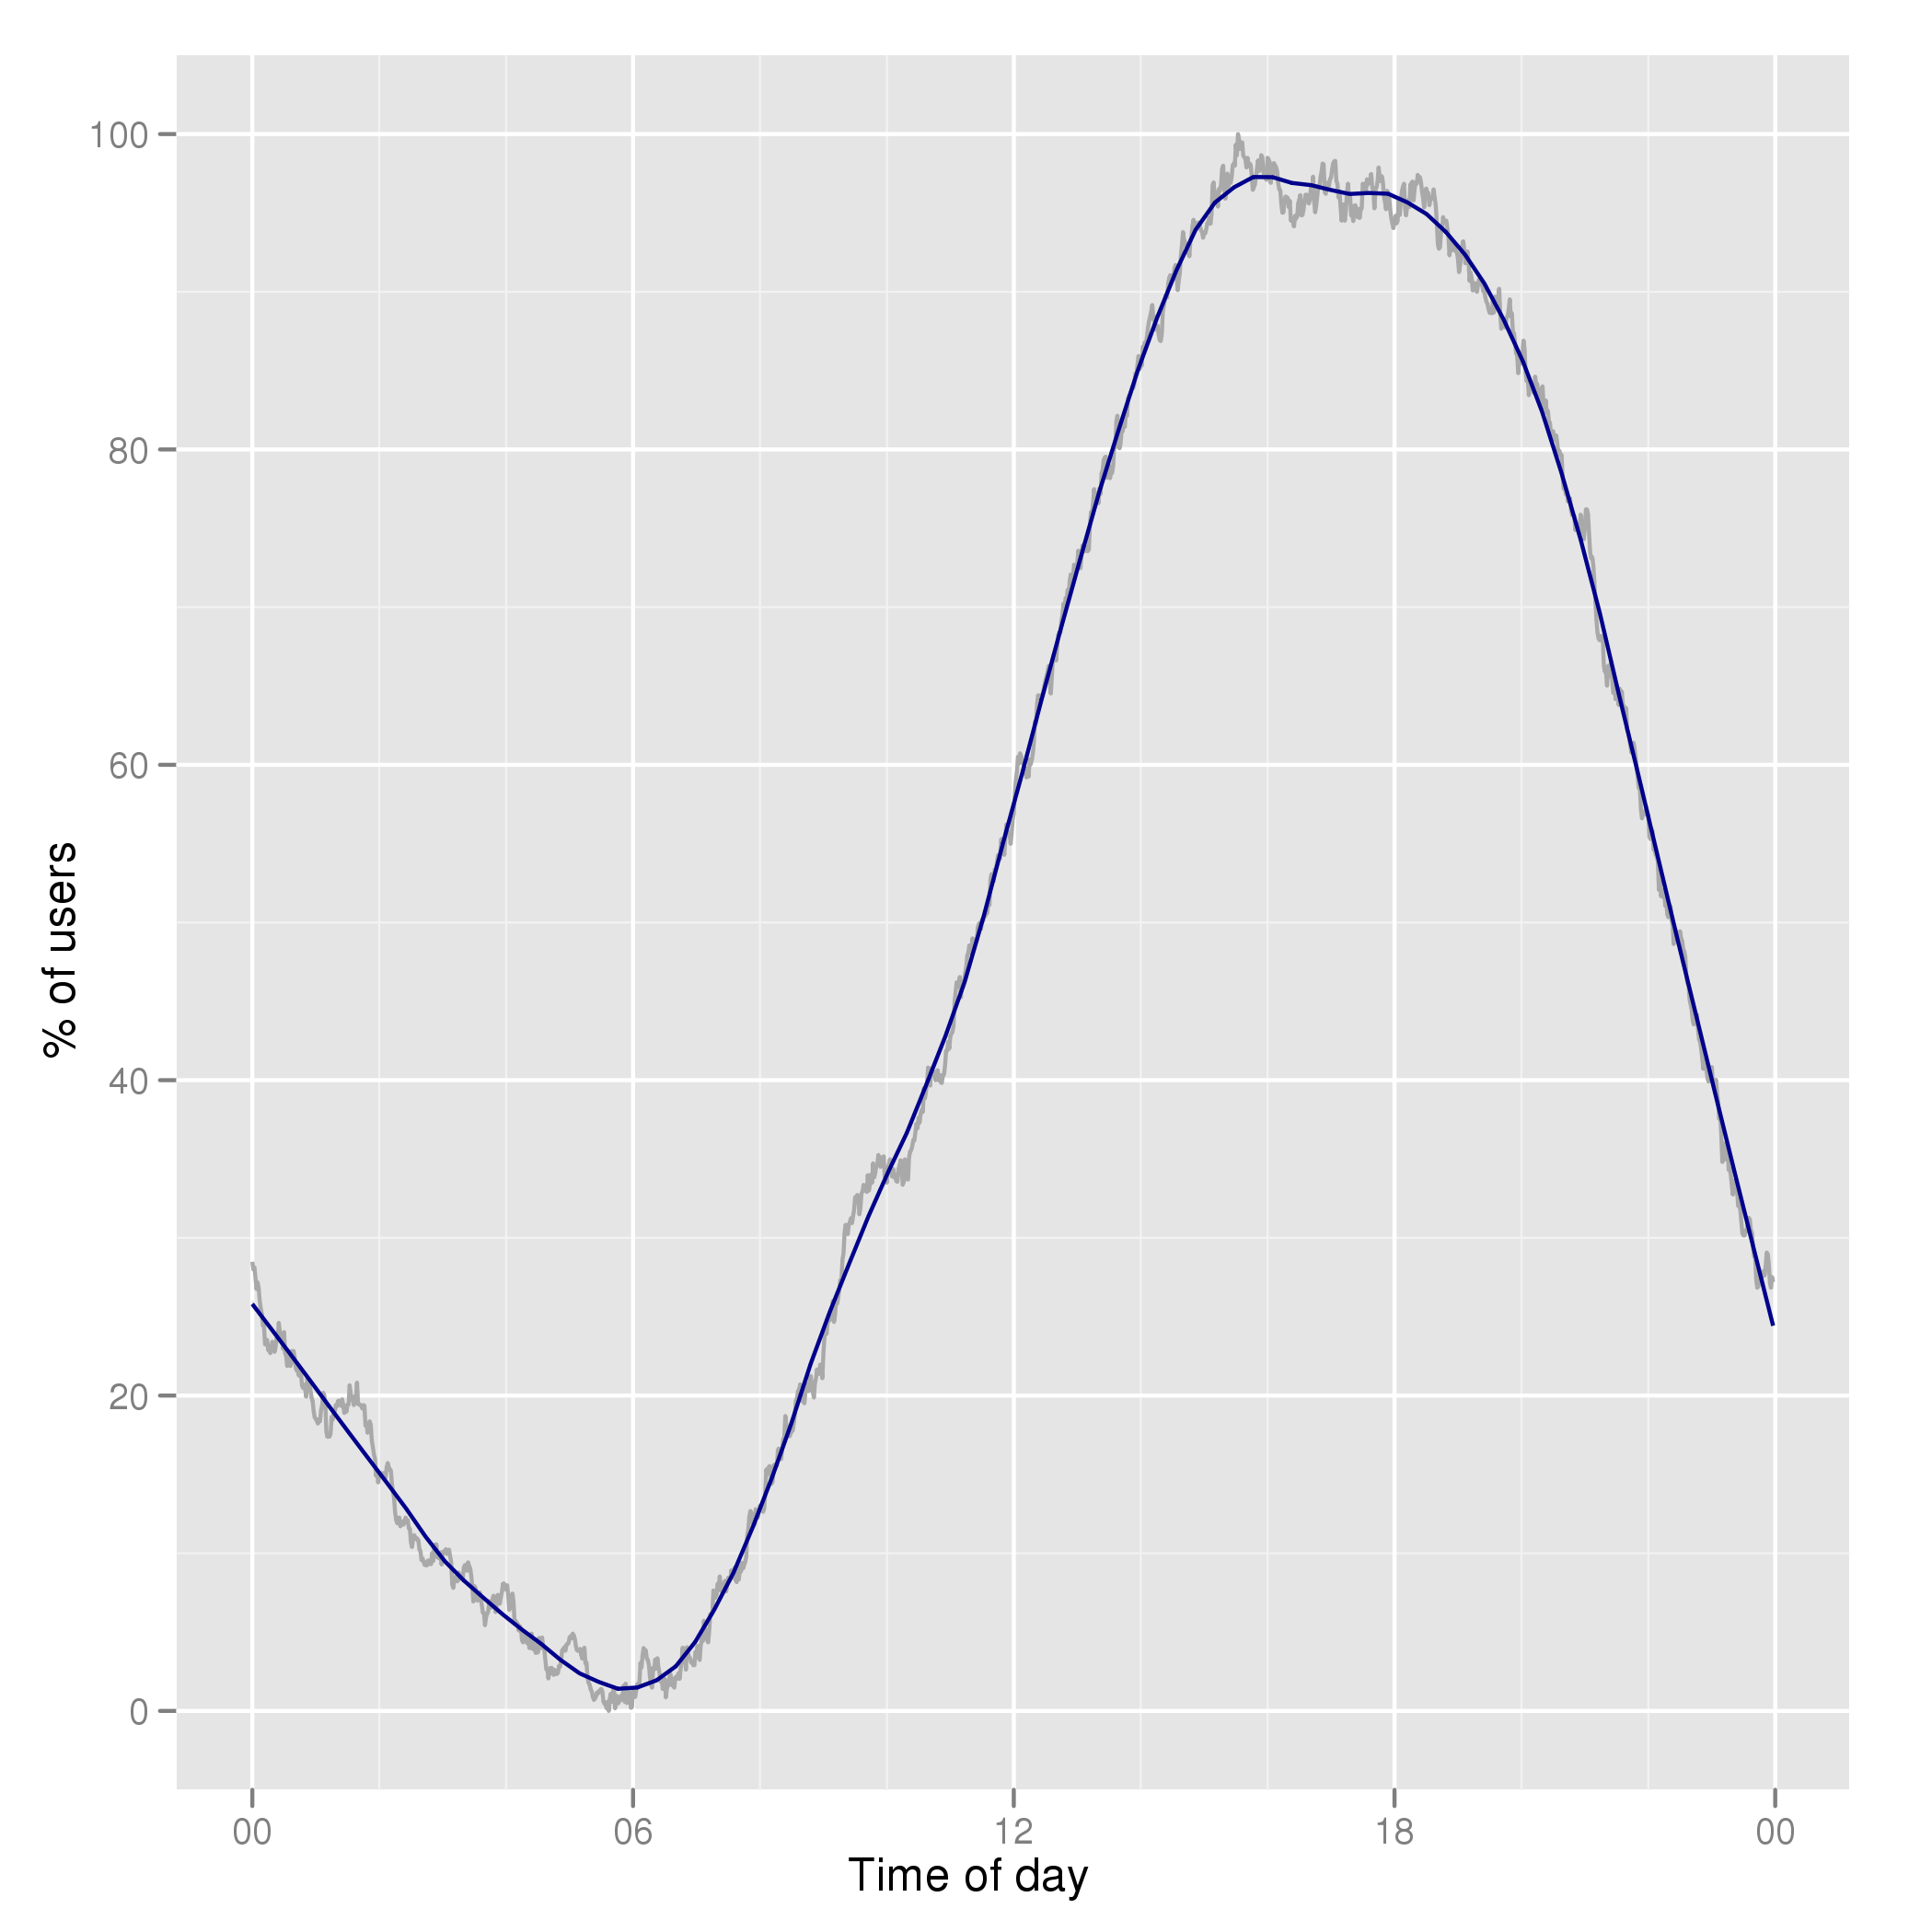
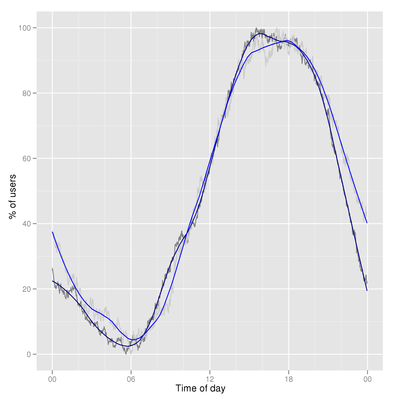
First of all, here is the overall active-use distribution of Firefox,
over the course of a day:
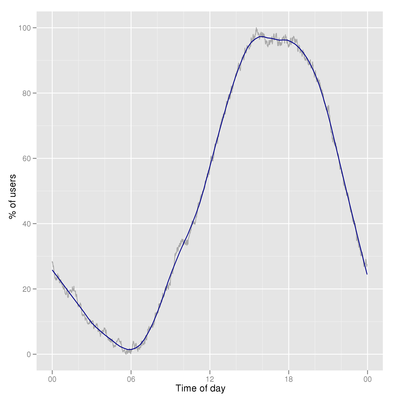
I found this quite interesting—Firefox is a "late afternoon"
browser. As the morning rolls in, usage picks up steadily until around
3pm when it stabilizes for two hours, and then decreases into
the night.
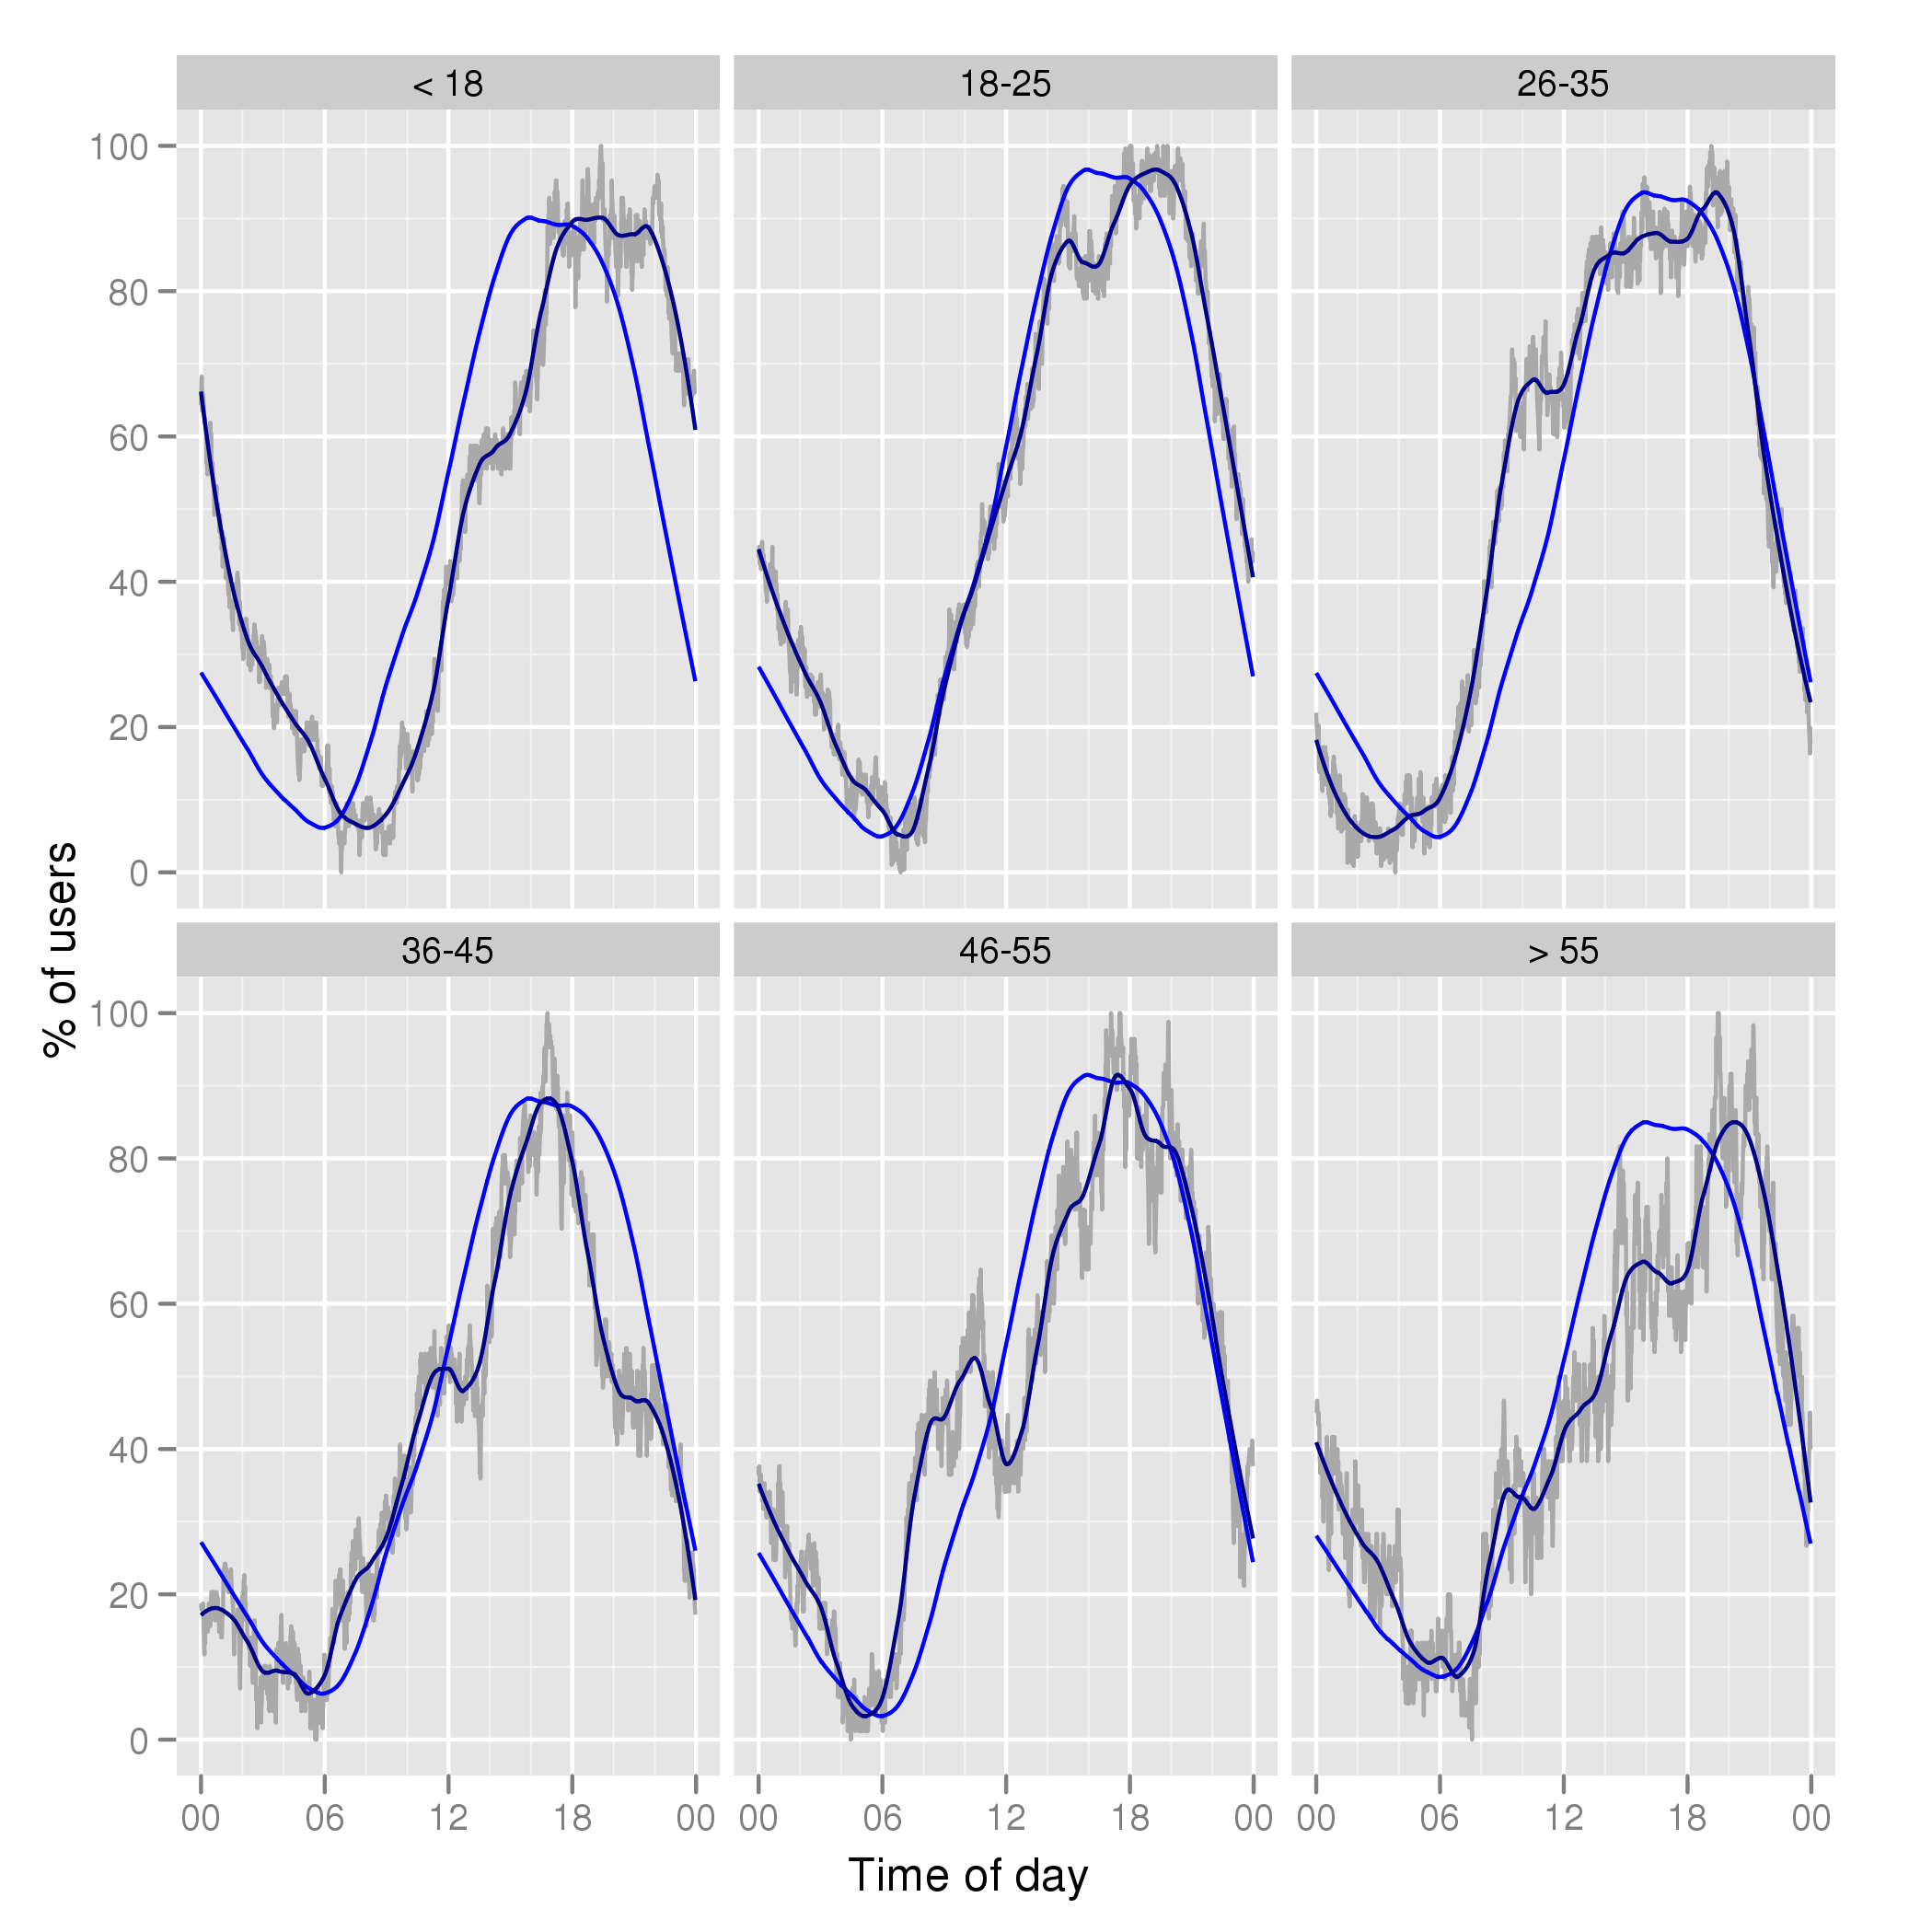
So how does browsing activity vary by age group? Below is the activity
profile for each age group. The dark-blue curve is smoothing out the
actual data points, which are shown in light gray. For comparison,
the overall distribution (as shown above, in light blue) is also
shown. To make the horizontal shifts more readily apparent, I
adjusted the overall distribution vertically to align at the minimum
at maximum points with that for each each group.
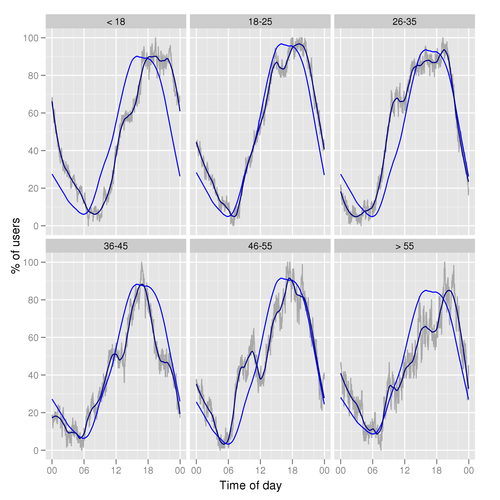
Several conclusions can be made:
- The under-18 youngsters are night owls, perhaps as could be
expected. Their browser usage peaks substantially later than the
overall one, continuing throughout the night.
- The same holds for the 18-25 group, though less so.
- Between 26 and 35, morning usage actually sets in earlier, while
usage peaks slightly after the overall, and decrease in the evening is
pretty much exactly the norm.
- From 36 to 45 we see a clear noon-time usage dip (!) and
below-average use during the afternoon and early evening.
- The folks between 46 and 55 are early-birds, with a more
pronounced lunchtime usage dip and typical evening behavior.
- Finally, the group above 55 years is again shifting toward later
use, with a nice interruption around dinner time.
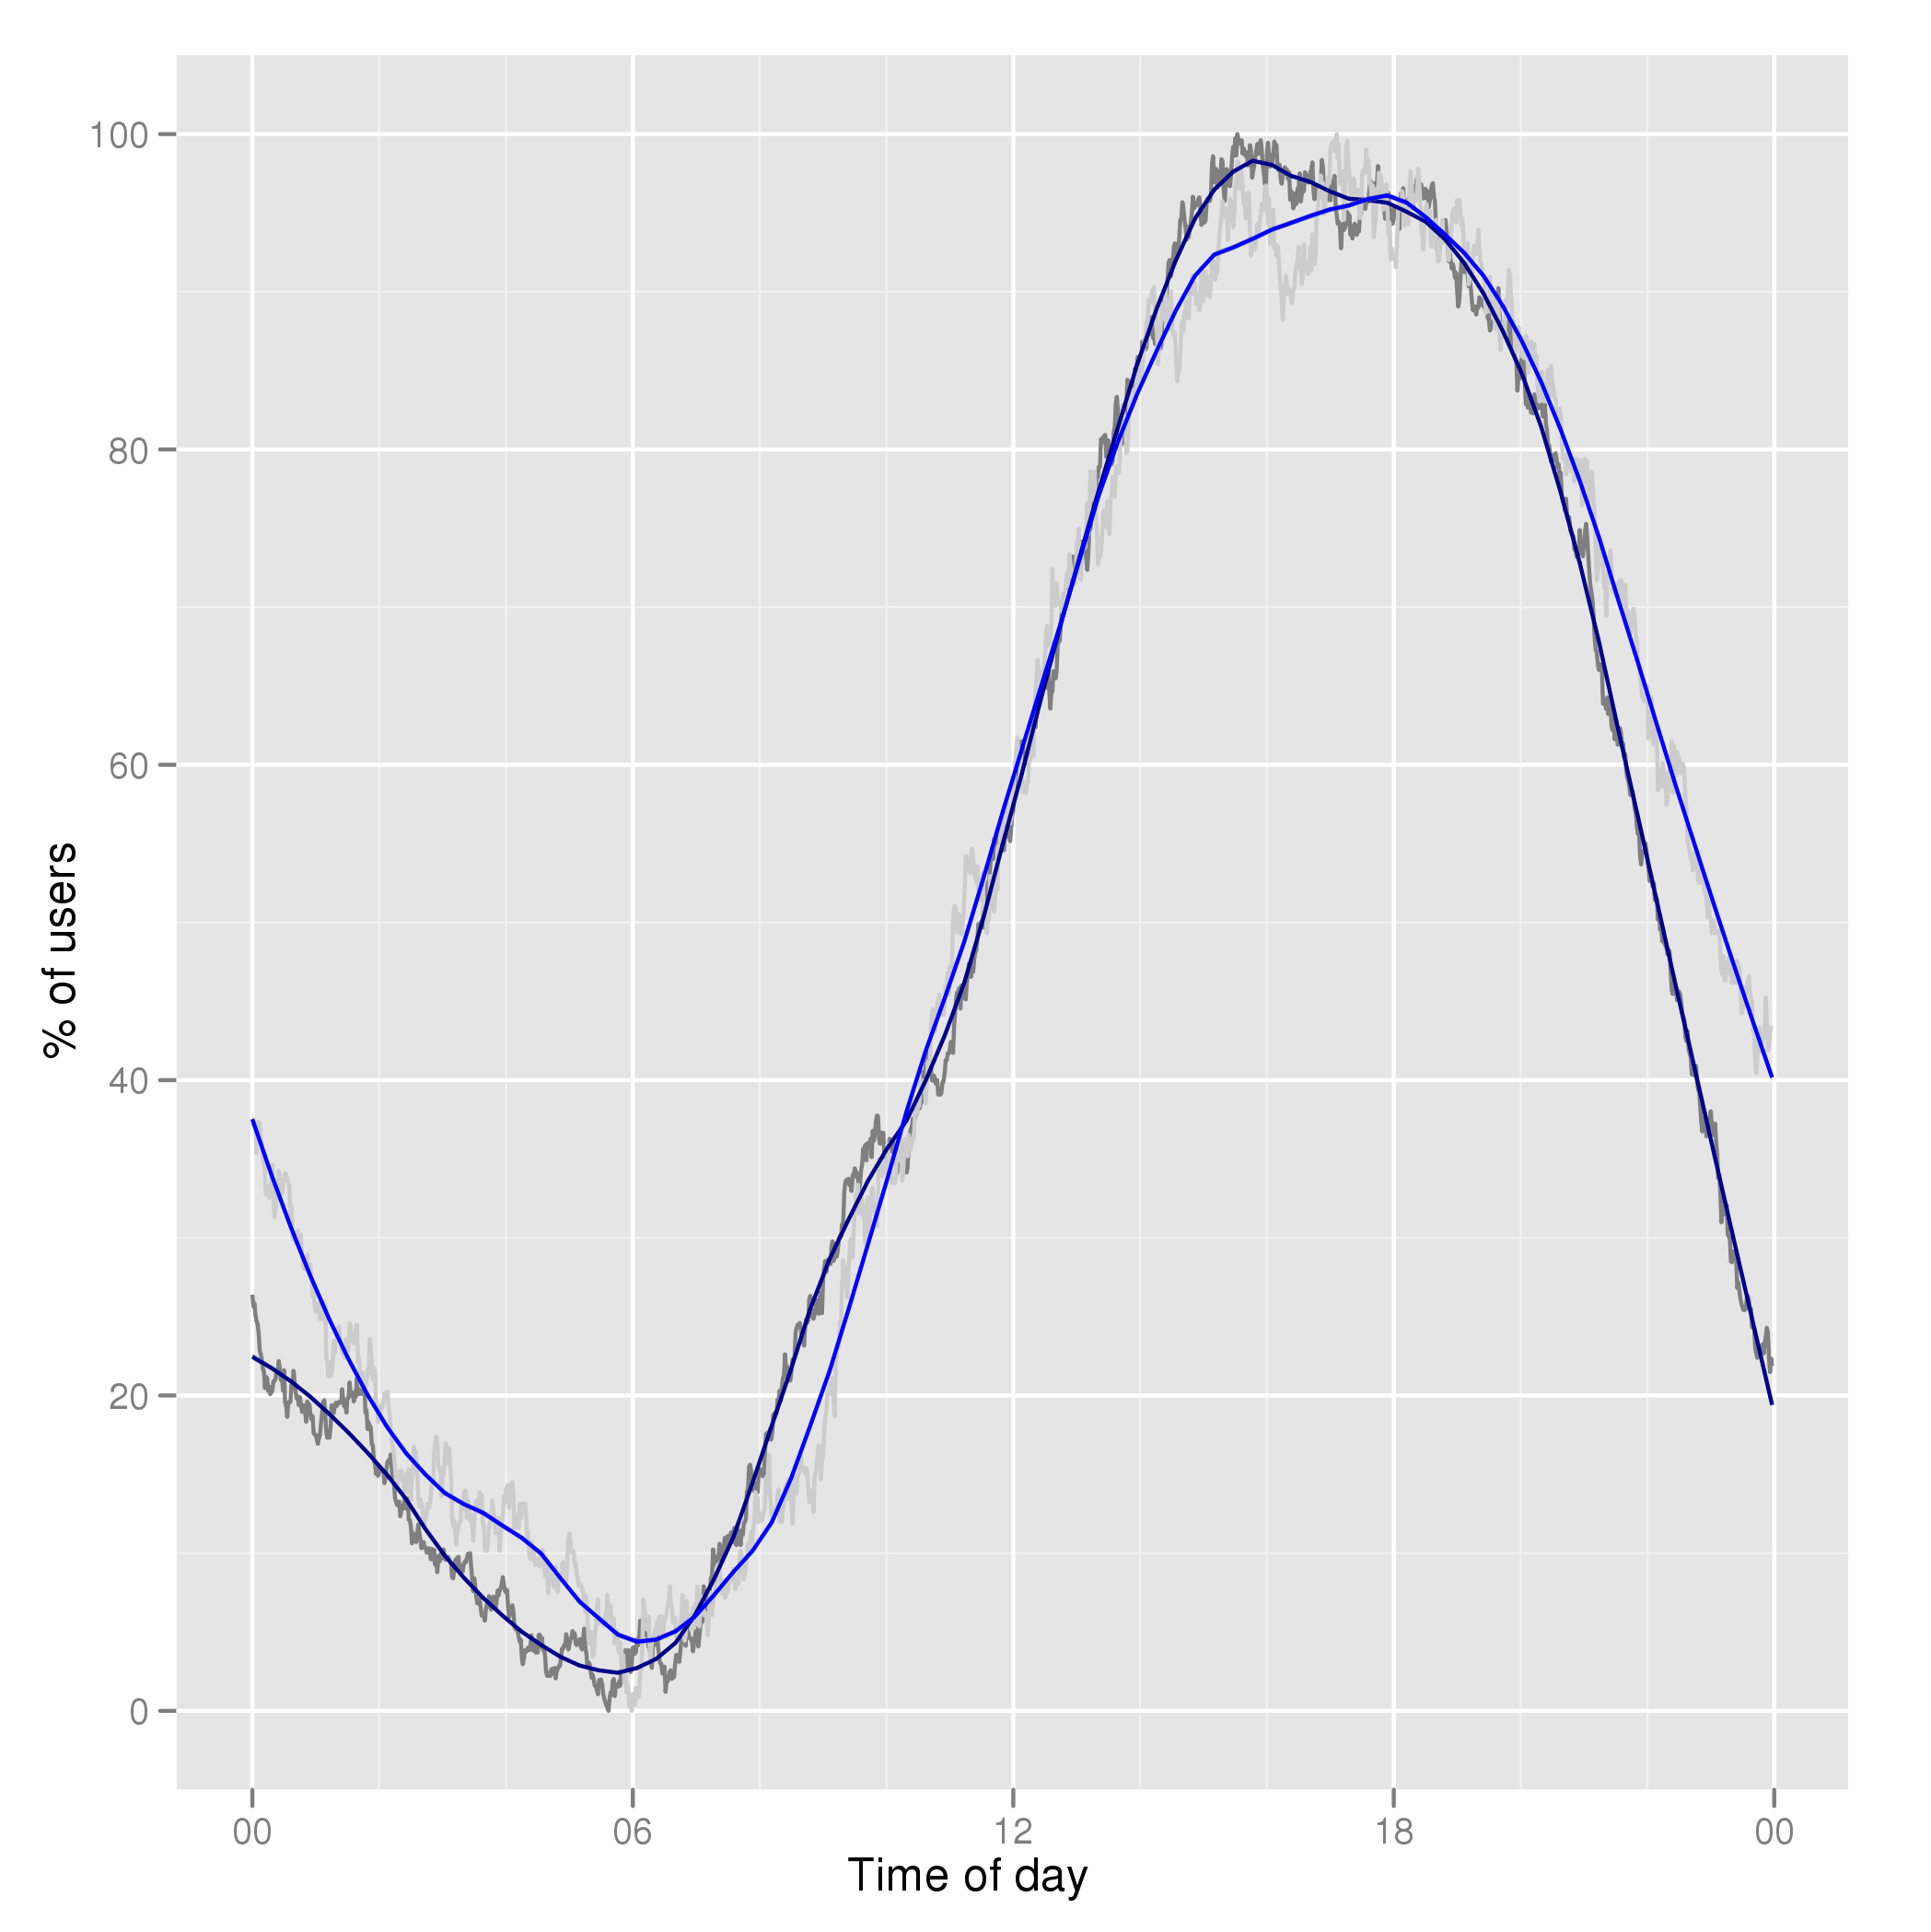
Weekday-weekend discrepancies
People's browser use during the week can differ substantially from
that during the weekend, for example when the workplace enforces a
particular browser product. The following plot compares the overall
activity profiles for the week (dark blue) and the weekend (light
blue):
We can see that the differences, in aggregate, are fairly
minor. Browser use is slightly shifted to later times on the weekend.
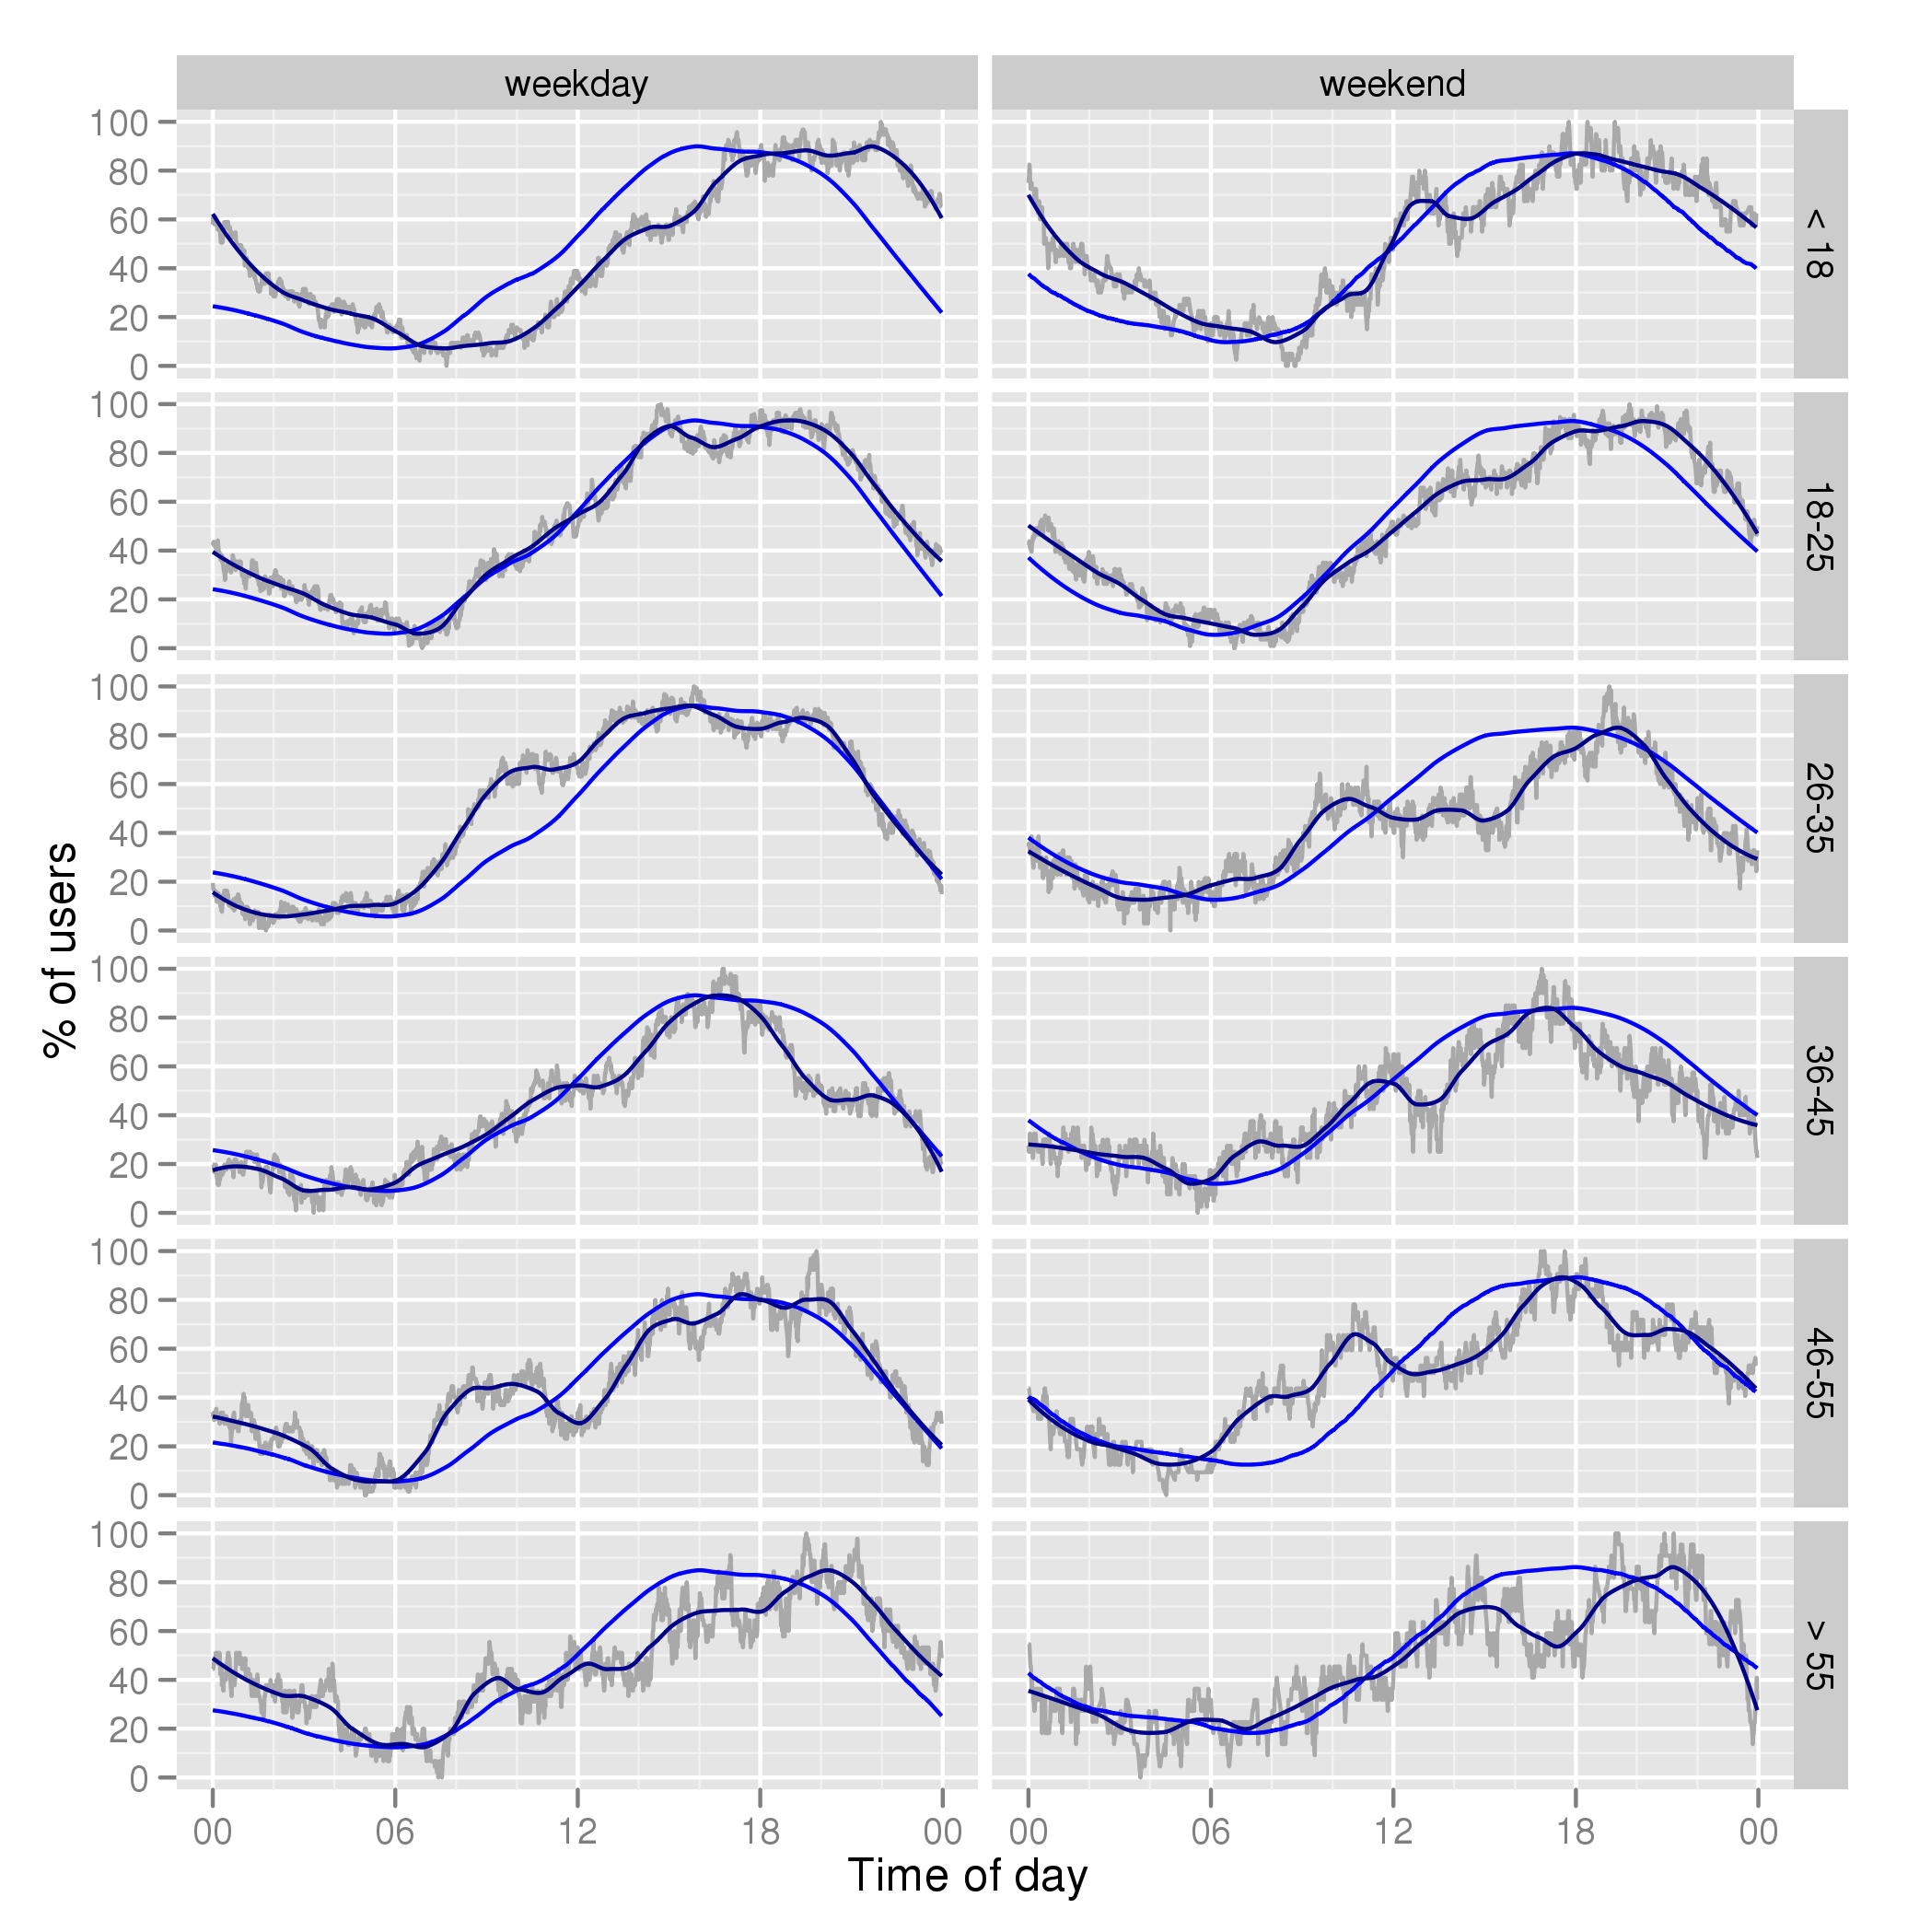
But again, what about different age groups? Below is the comparison
for the weekday (left) and the weekend (right). The light blue line
is again the overall distribution, separate for weekday (left) and
weekend (right), and the dark blue line reflects the age group.
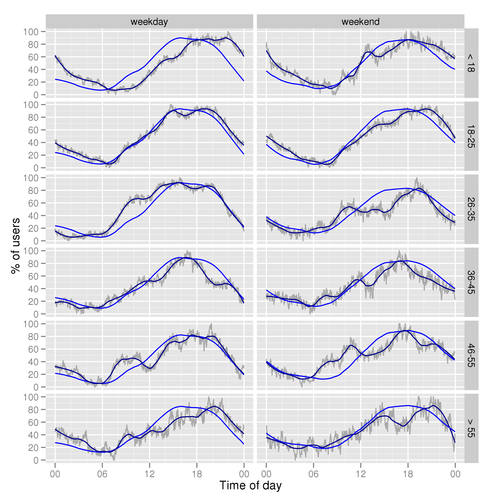
Conclusions:
- Especially during the week, folks up to 18 use the browser later
than the rest. During the weekend, usage in the afternoon is
comparatively low.
- For the group 18-25, usage difference is rather minor, and during
the weekend mornings usage is only somewhat less than during the
week.
- The group 26-35 shows markedly different behavior during the day:
in the week, usage is above average (perhaps reflecting increased
ability to use Firefox in the work environment?), while on the weekend
it is below (because they sleep in? :).
- The group 55+ is below average during the weekday, but only below
average in the early evening during the weekend.
Resources
- The code that produces the plots on this page.
tar.gz